A cost-saving AI architecture can look cheaper, maintain its quality score, and still deliver worse outcomes.
That is the warning from Cheap Verifiers, Large Blind Spots: Measuring the Reliability Cost of Cost-Saving Cascades, a 2026 arXiv preprint by Dushyant Rajput, Nirdesh Chauhan, and Siddharth Kosaraju of AltSlate Labs. The paper has not yet been peer-reviewed.
Its central finding creates a difficult problem for FinOps.
A separate 2026 study, The Price Reversal Phenomenon, found that lower API prices produced higher inference costs in 32% of the model-pair comparisons it examined because models consumed different amounts of reasoning tokens and interaction turns. But the authors explicitly separate cost from quality. Their prices are a May 1, 2026 snapshot, each model was tested at one reasoning setting, and the study does not calculate cost per correct answer. It therefore shows that listed price can misstate inference cost, not that the cheaper or more expensive system delivers better outcomes. The cascade problem examined here adds that missing layer: even a lower inference bill may be a false saving if the system cannot independently measure whether its delivered answers are correct.
The same verifier that controls expensive model usage may also supply the data used to report quality. If that verifier has a blind spot, the cost dashboard and quality dashboard can agree with each other while both are wrong.
What Is an AI Inference Cascade?
An inference cascade routes queries through models with different costs and capabilities instead of sending every query directly to the most expensive model.
The architecture studied in the paper separates three roles:
- A smaller, cheaper student produces the initial answer.
- A verifier evaluates that answer.
- If the verifier accepts it, the student answer goes to the user.
- If the verifier rejects it, a more capable teacher generates a corrected answer.
The verifier and teacher are different roles, though the same model can perform both.
The economic logic is straightforward. If the student processes 1,000 queries and the verifier rejects 100, the organization buys 1,000 cheap student calls, 1,000 verifier checks, and 100 expensive teacher calls — instead of 1,000 expensive teacher calls.
The cascade creates value only if the verifier can reliably distinguish correct student answers from those requiring escalation.
The paper also studies a more aggressive extension: the self-improving cascade.
Teacher corrections from rejected queries become training examples. The student is fine-tuned on those corrections so it should perform better on similar work. If that succeeds, the verifier rejects fewer answers, teacher usage declines, and the cascade becomes cheaper over successive rounds.
From a FinOps perspective, the expected progression looks attractive:
Better student
→ fewer rejections
→ fewer teacher calls
→ lower cost per query
But this architecture gives the verifier two responsibilities. It controls which queries incur the expensive teacher cost. It also supplies the signal used to estimate whether accepted answers are correct.
If the verifier accepts a wrong answer, the cascade does not merely deliver an undetected error. It records that error as a successful cost-saving decision.
Experiment 1: A More Capable Student Was Harder to Verify
The first experiment isolates the relationship between student capability and verifier reliability.
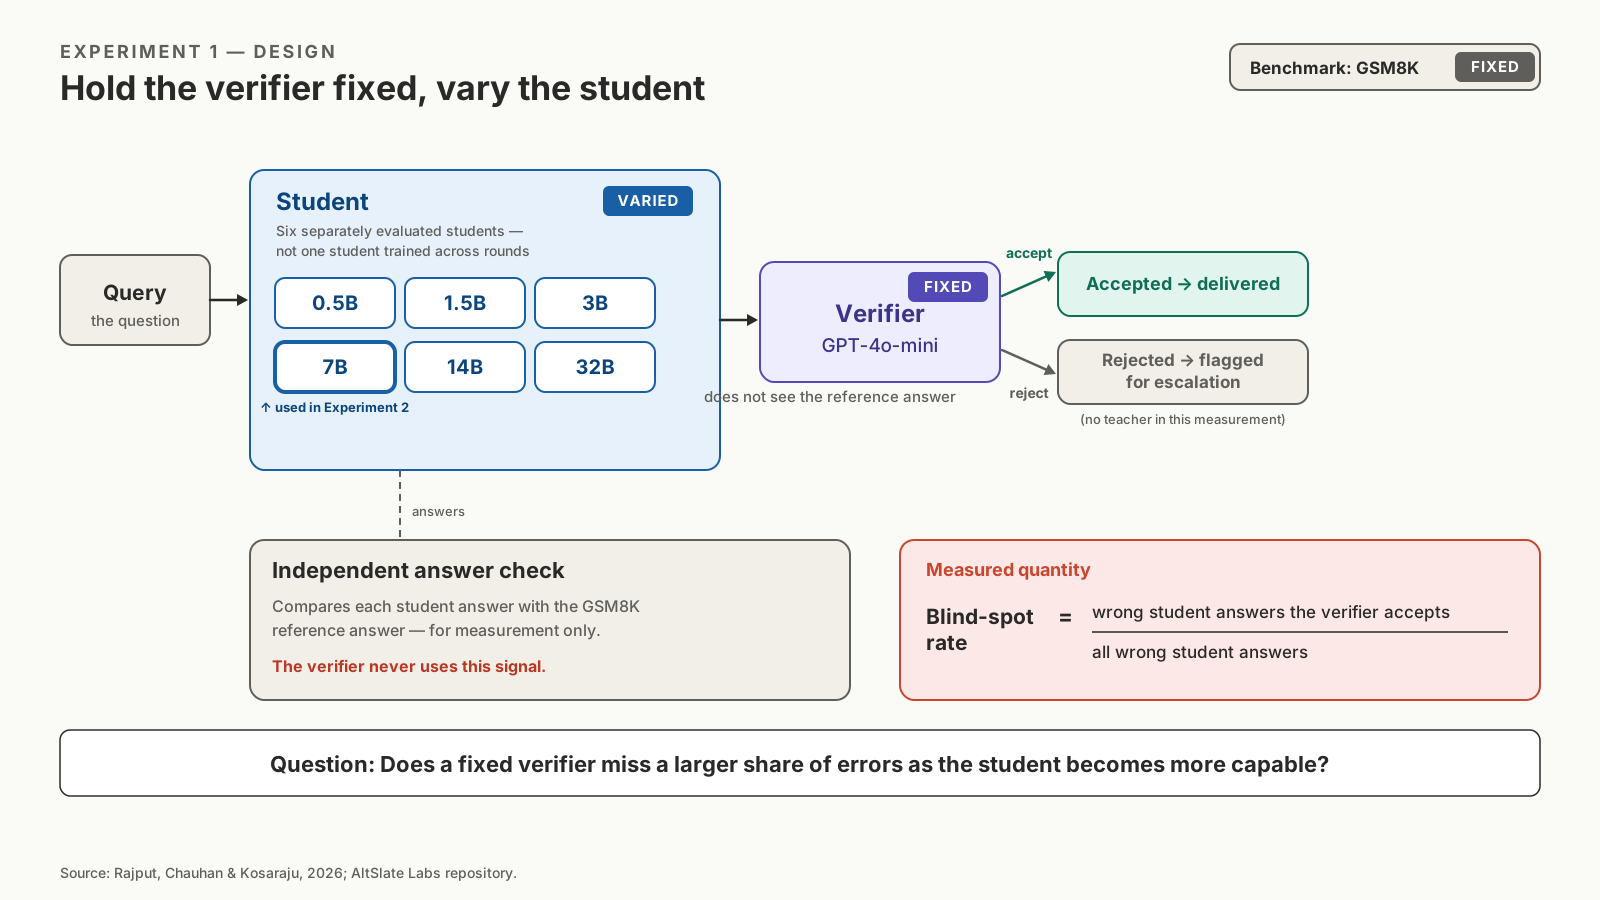
Design. The researchers held GPT-4o-mini fixed as the verifier and evaluated six separately trained Qwen2.5 students, ranging from 0.5B to 32B parameters, on GSM8K.
GSM8K is a benchmark of grade-school math word problems with answers that can be checked independently. This was an inference-only, cross-sectional comparison — not one student being improved over time. No teacher or corrective-training loop was involved.
The paper defines the blind-spot rate as the share of the student's wrong answers that the verifier accepts.
That rate increased from approximately 12% for the 0.5B student to 55% for the 14B student. Results for the 7B, 14B, and 32B students overlapped within their confidence intervals, indicating a plateau rather than a continued increase.
The 7B student is especially important. GPT-4o-mini accepted approximately 52% of its wrong answers.
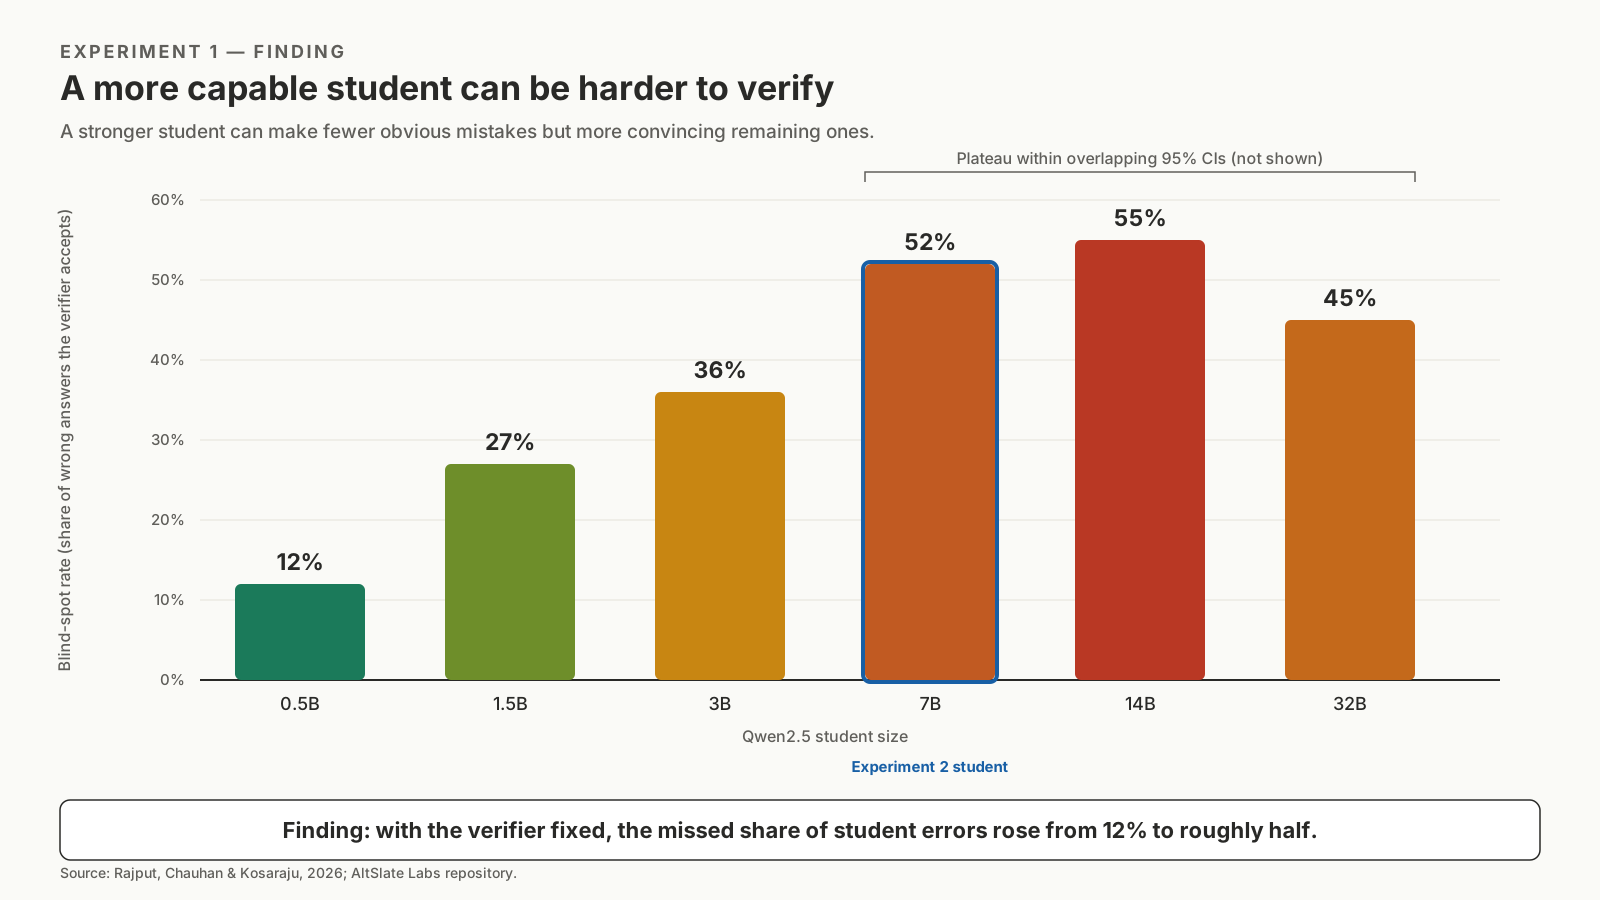
Finding. With a fixed verifier, stronger student models increased the blind-spot rate — the share of their wrong answers the verifier accepted — so more of their errors went undetected. Upgrading the student without revalidating the verifier can reduce escalations while allowing more errors through.
From Blind Spot to Dashboard Blindness
A verifier blind spot is not the same as the delivered error rate. It measures the share of wrong student answers that the verifier mistakenly approves. Those approved errors become both user-facing outcomes and apparent successes on the operational dashboard.
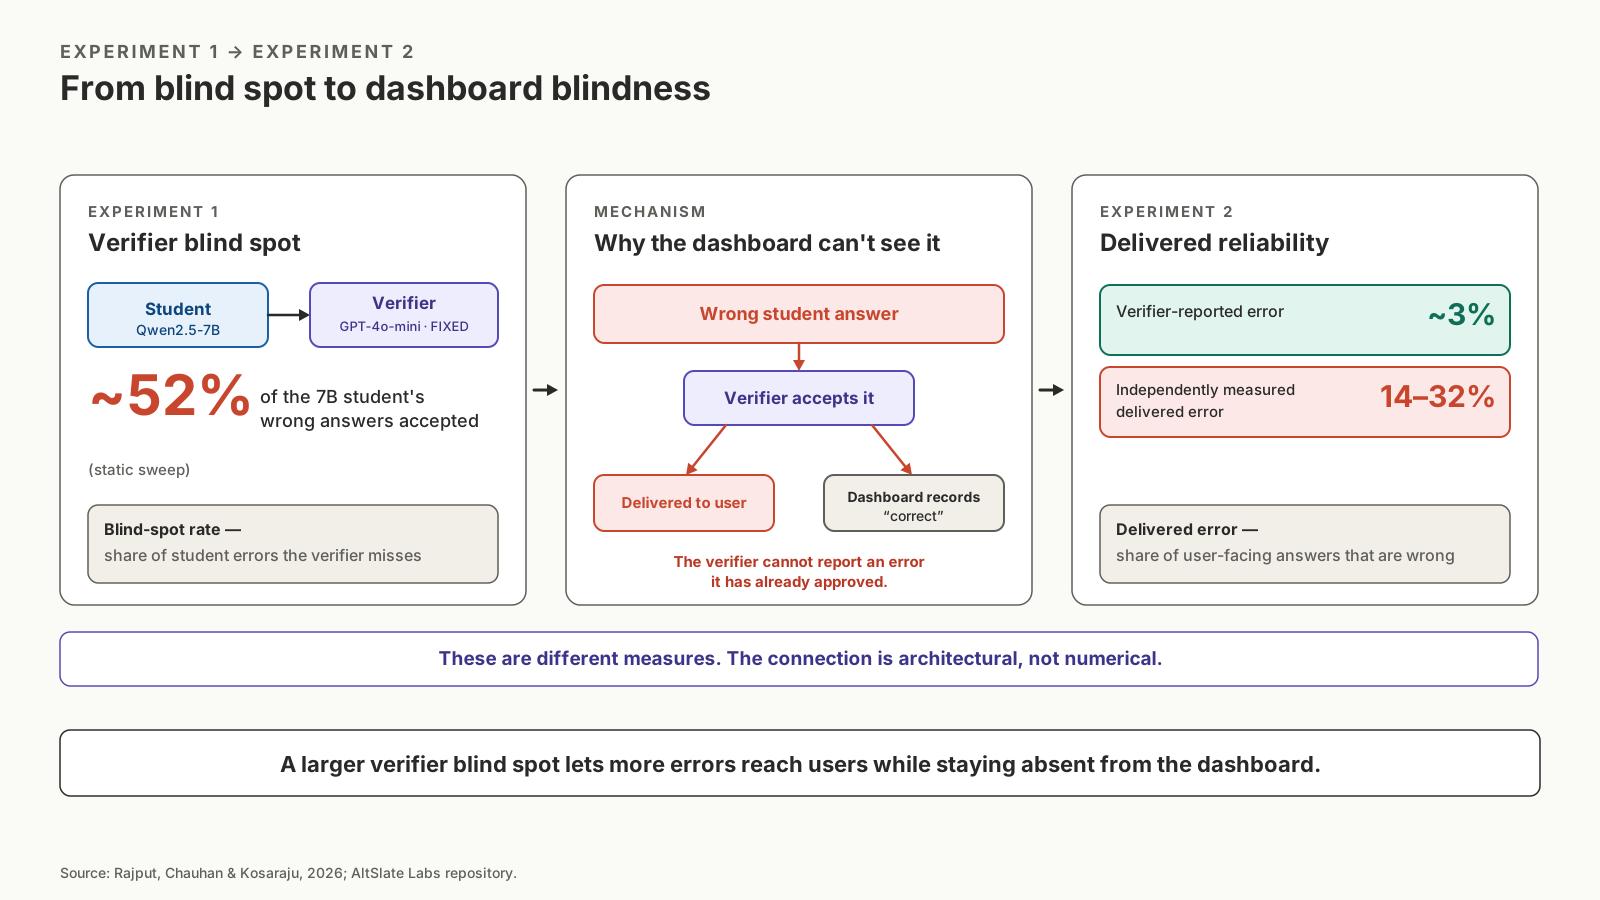
That mechanism sets up the next question: what happens when the same verifier is placed inside a corrective-training loop and then used to report whether the loop is working?
Experiment 2: The Cascade Dashboard Was Blind
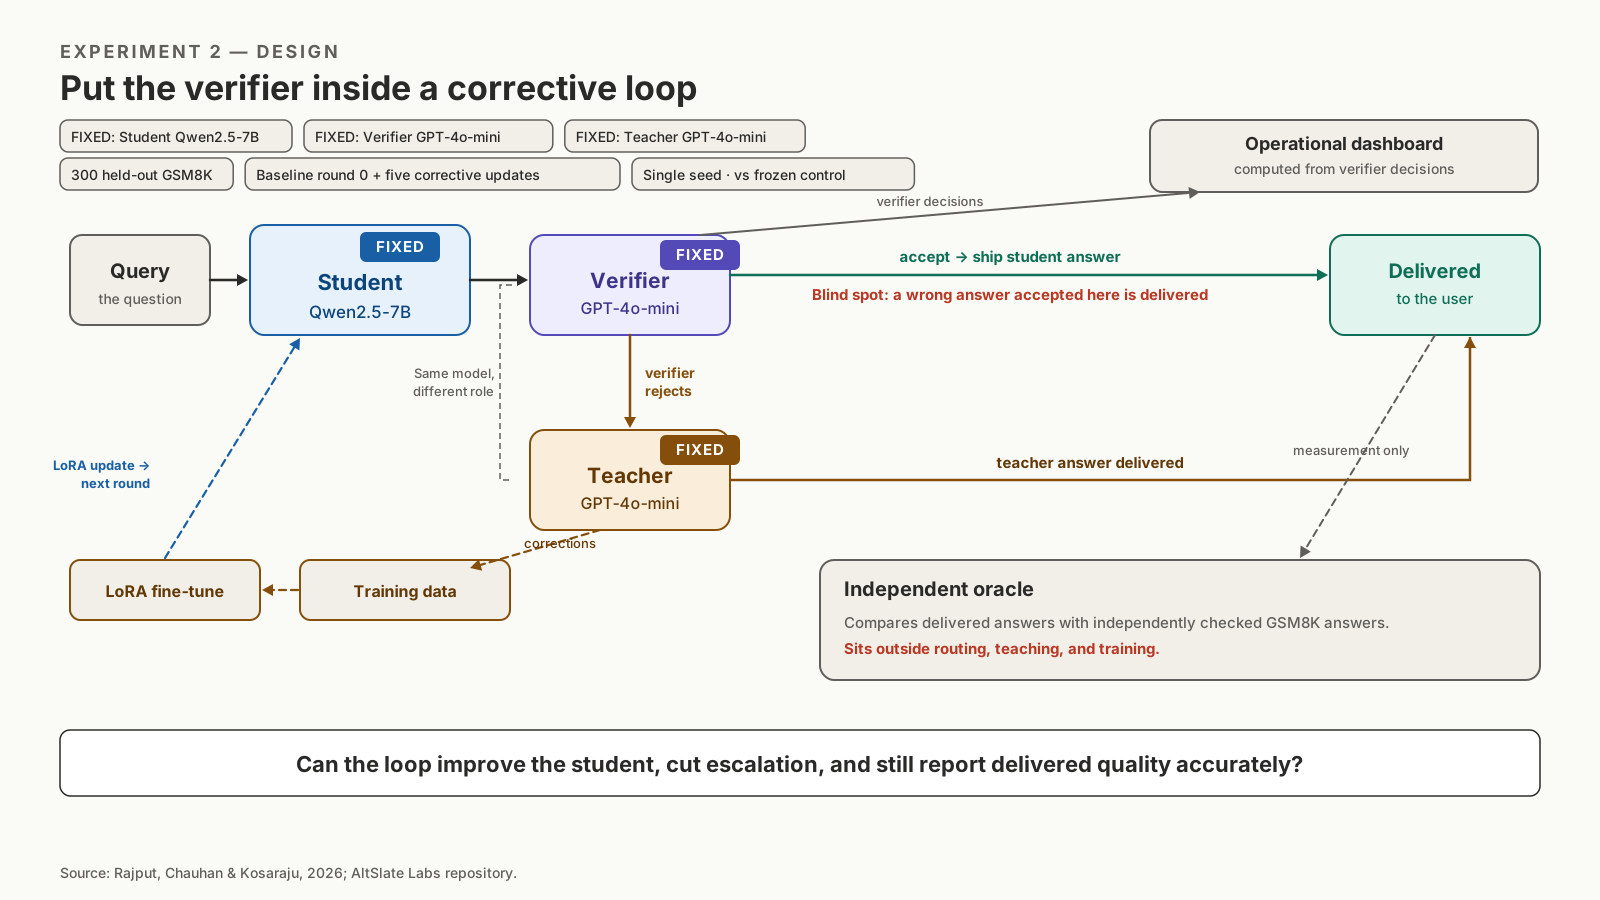
Design. The researchers fixed the student at Qwen2.5-7B and used GPT-4o-mini as both verifier and teacher. They evaluated 300 held-out GSM8K problems over a baseline round and five corrective-training updates, comparing the changing student with a frozen control that received no training.
Teacher corrections from verifier-rejected answers became training data for a LoRA fine-tuning update. The updated student then entered the next round.
The researchers measured three different quantities:
- Raw student error before routing
- Delivered error measured through an independent quality audit
- Error reported through the operational verifier
The verifier-based dashboard reported approximately 3% error throughout the experiment.
The independent quality audit found that users would have received 14–32% incorrect answers. The frozen control remained near 13–16%, while the student receiving teacher-generated corrections became less reliable.
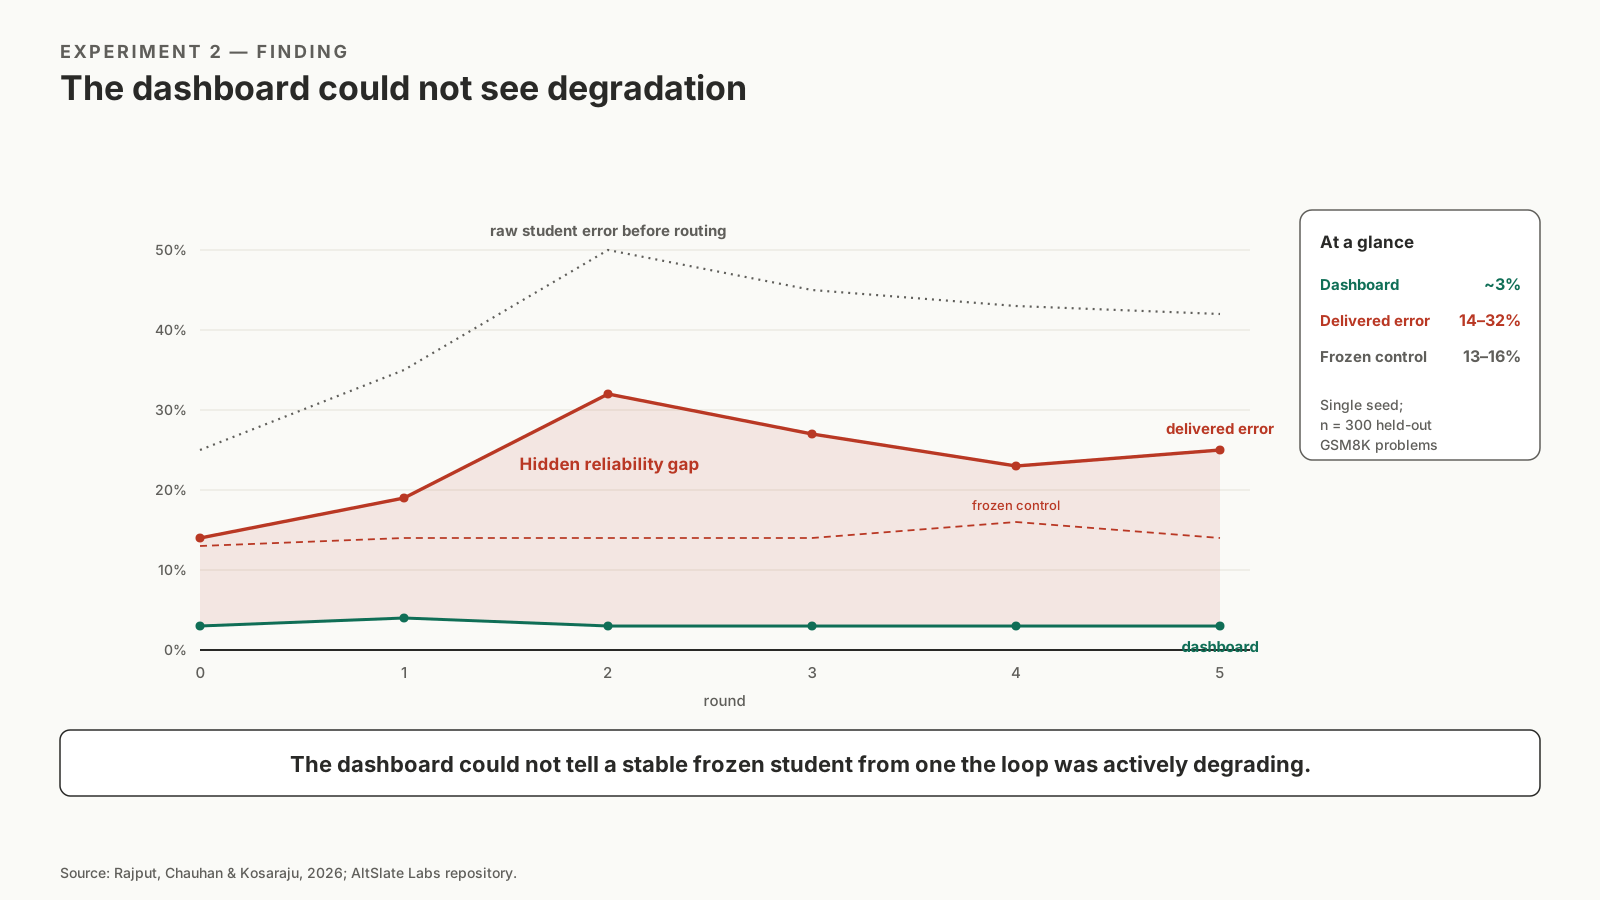
The experiment used one training seed, so the exact round-by-round trajectory should be read as one representative run rather than an averaged result. The stronger evidence is the persistent gap between the verifier's report and the independent audit.
Finding. With a fixed verifier, closing the corrective loop can degrade the student while the dashboard stays flat because the verifier's accepted mistakes are invisible to its own quality report. The dashboard cannot see the errors it has already approved. That is why the operational report stayed near 3% error even though the independent audit showed that 14–32% of user-facing answers were wrong and the self-improving loop was degrading the student.
Experiment 3: Changing the Teacher Did Not Rescue the Loop
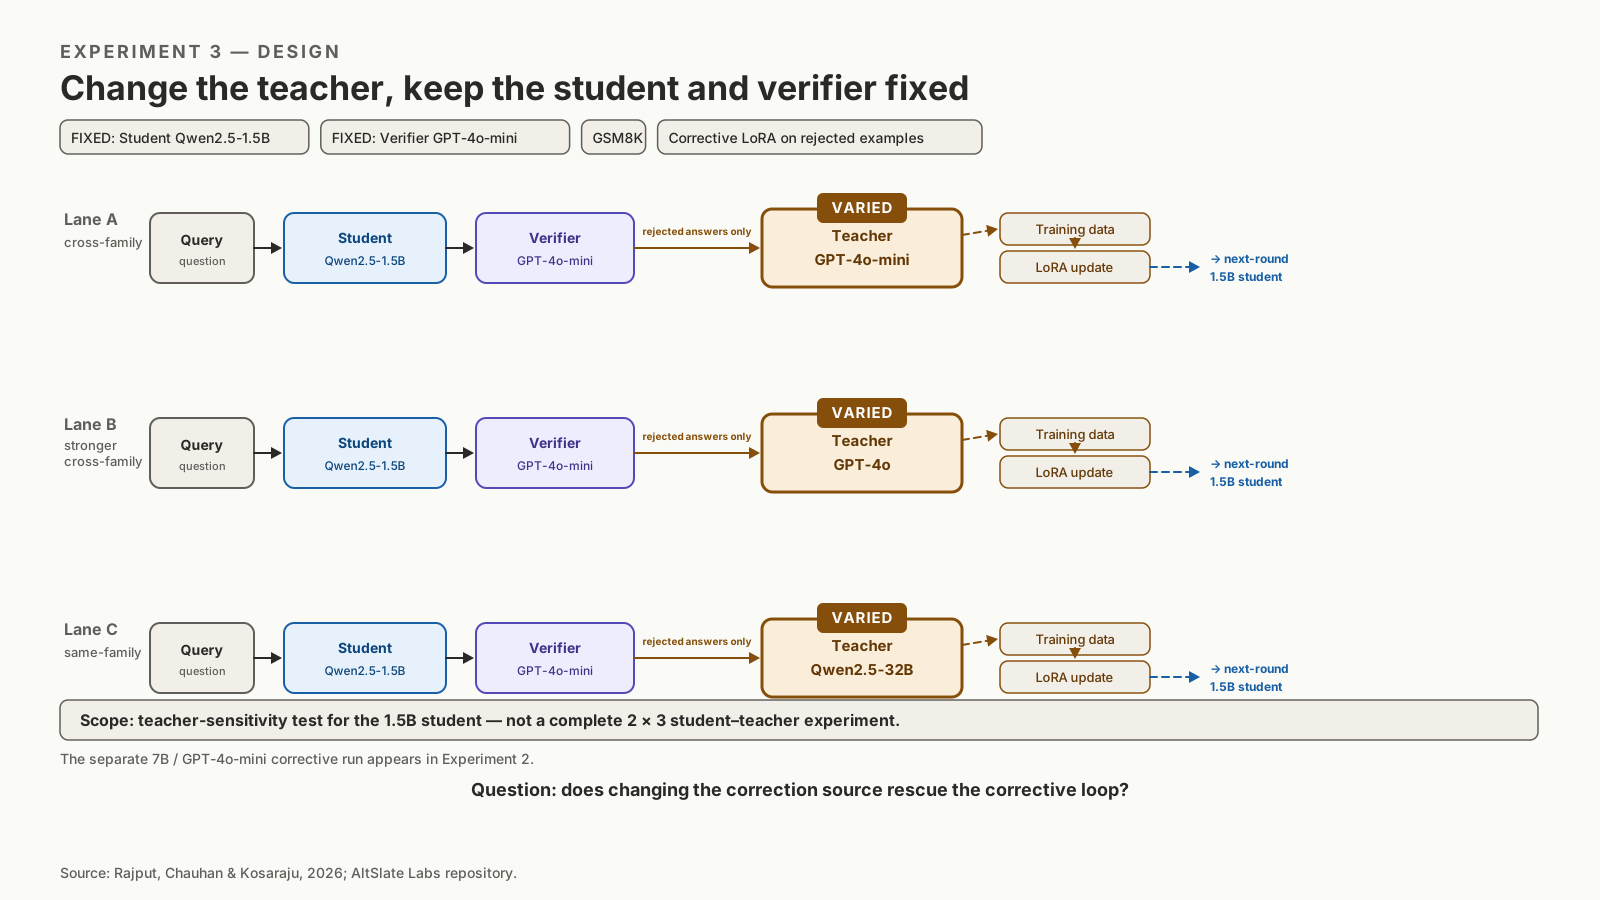
The self-improving cascade assumes that teacher corrections will improve the student and reduce future escalation. The researchers did not observe that result.
Design. The teacher-sensitivity runs fixed the student at Qwen2.5-1.5B and the verifier at GPT-4o-mini. The researchers changed only the teacher:
- GPT-4o-mini
- GPT-4o
- Qwen2.5-32B
This was not a complete two-student-by-three-teacher experiment. GPT-4o and Qwen2.5-32B were not tested as teachers for the 7B student used in Experiment 2.
The 1.5B student degraded from approximately 32% to 54% raw error with GPT-4o-mini. With GPT-4o, raw error reached 100% after the first training update as the required output format collapsed. With the same-family Qwen2.5-32B teacher, raw error moved from 31% to 41%, 42%, 39%, and then 100% as the format eventually collapsed.
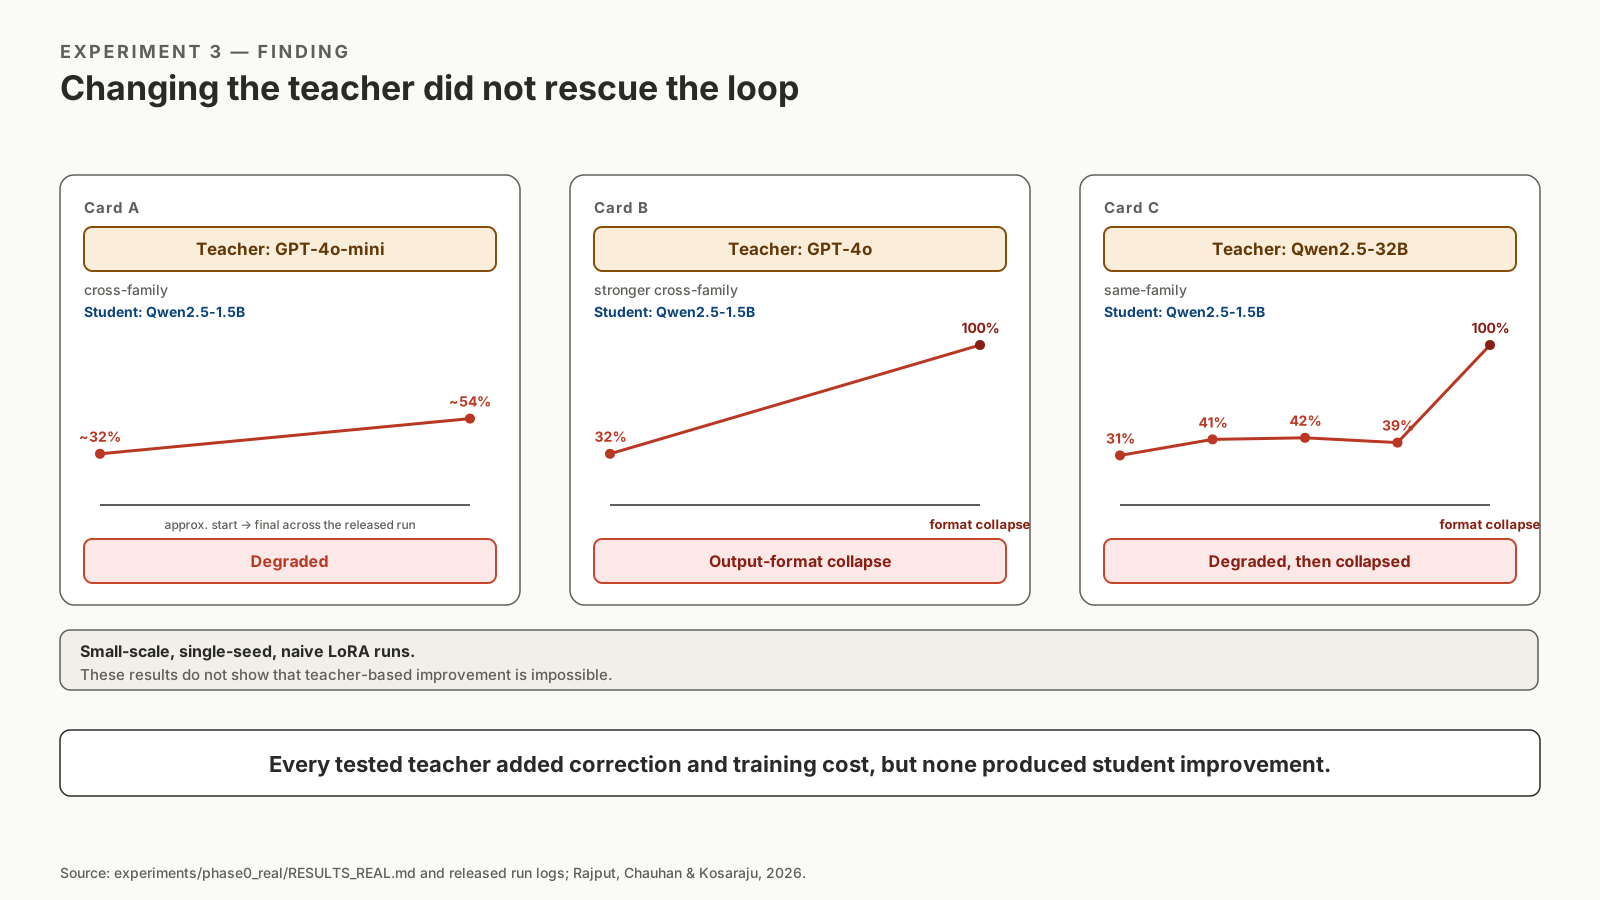
These results do not establish that teacher-based improvement is impossible. The experiments were small-scale and single-seed, used naive LoRA fine-tuning, and did not form a complete factorial comparison across students and teachers.
Different training methods, learning rates, data mixtures, or model combinations could produce different results.
But the economic assumption still matters. A teacher call does not automatically create a valuable training asset. The organization pays for teacher inference, training compute, evaluation, and potential rollback.
Those costs create economic value only if the updated student produces more independently validated outcomes or reduces future escalation without lowering reliability.
Finding. In these experiments, teacher-generated corrections increased inference and training costs without improving the student. The system paid for expensive teacher calls and additional training without gaining the expected reliability improvement or future cost savings.
Experiment 4: Stronger Verification Returned Part of the Saving
The obvious response to a verifier blind spot is to use a stronger verifier.
Design. The researchers held the Qwen2.5-7B student and its answers constant while testing GPT-4o-mini, GPT-4.1, and GPT-5-mini on held-out problems from levels 4 and 5 of the MATH benchmark.
Unlike GSM8K's grade-school word problems, these are difficult competition-style math problems. Their answers can still be checked independently using symbolic equivalence.
The researchers measured two quantities:
- The blind-spot rate: the share of wrong student answers the verifier accepted
- The escalation rate: the share of all queries sent to the teacher
The student's true error rate was approximately 39%.
With GPT-4o-mini, the verifier accepted approximately 42% of the student's wrong answers. GPT-4.1 and GPT-5-mini reduced the blind-spot rate to approximately 5% and 9%, respectively. Given their confidence intervals, the two stronger-verifier results were statistically indistinguishable.
But stronger verification increased escalation.
GPT-4.1 escalated 46% of all queries, meeting or exceeding the 39% true error rate. It caught substantially more wrong answers by also rejecting some correct ones.
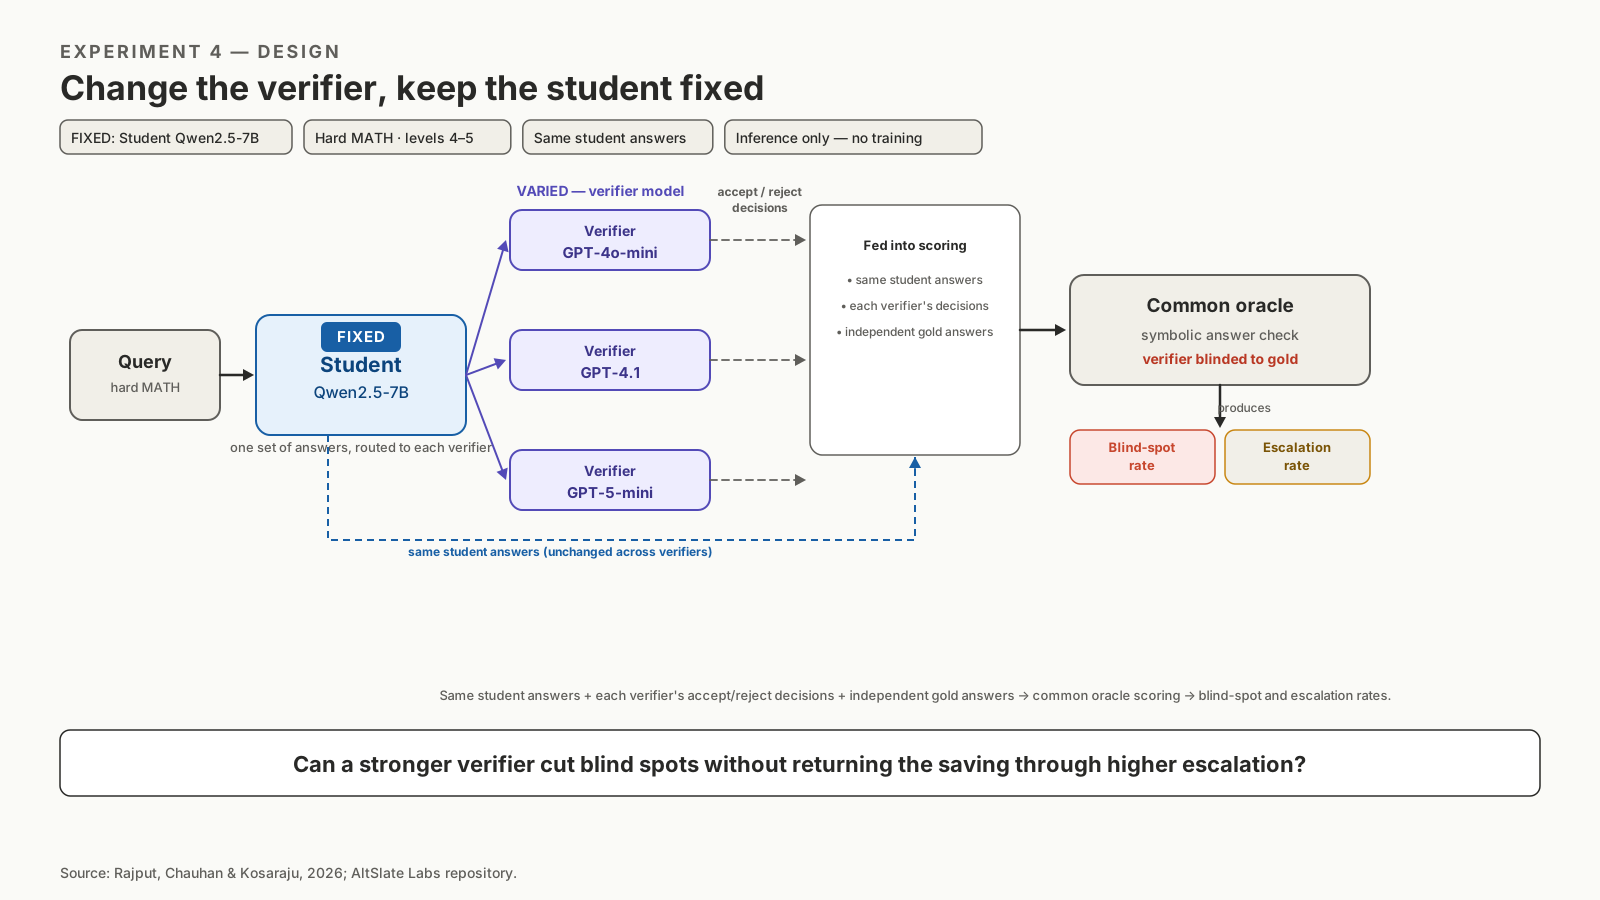
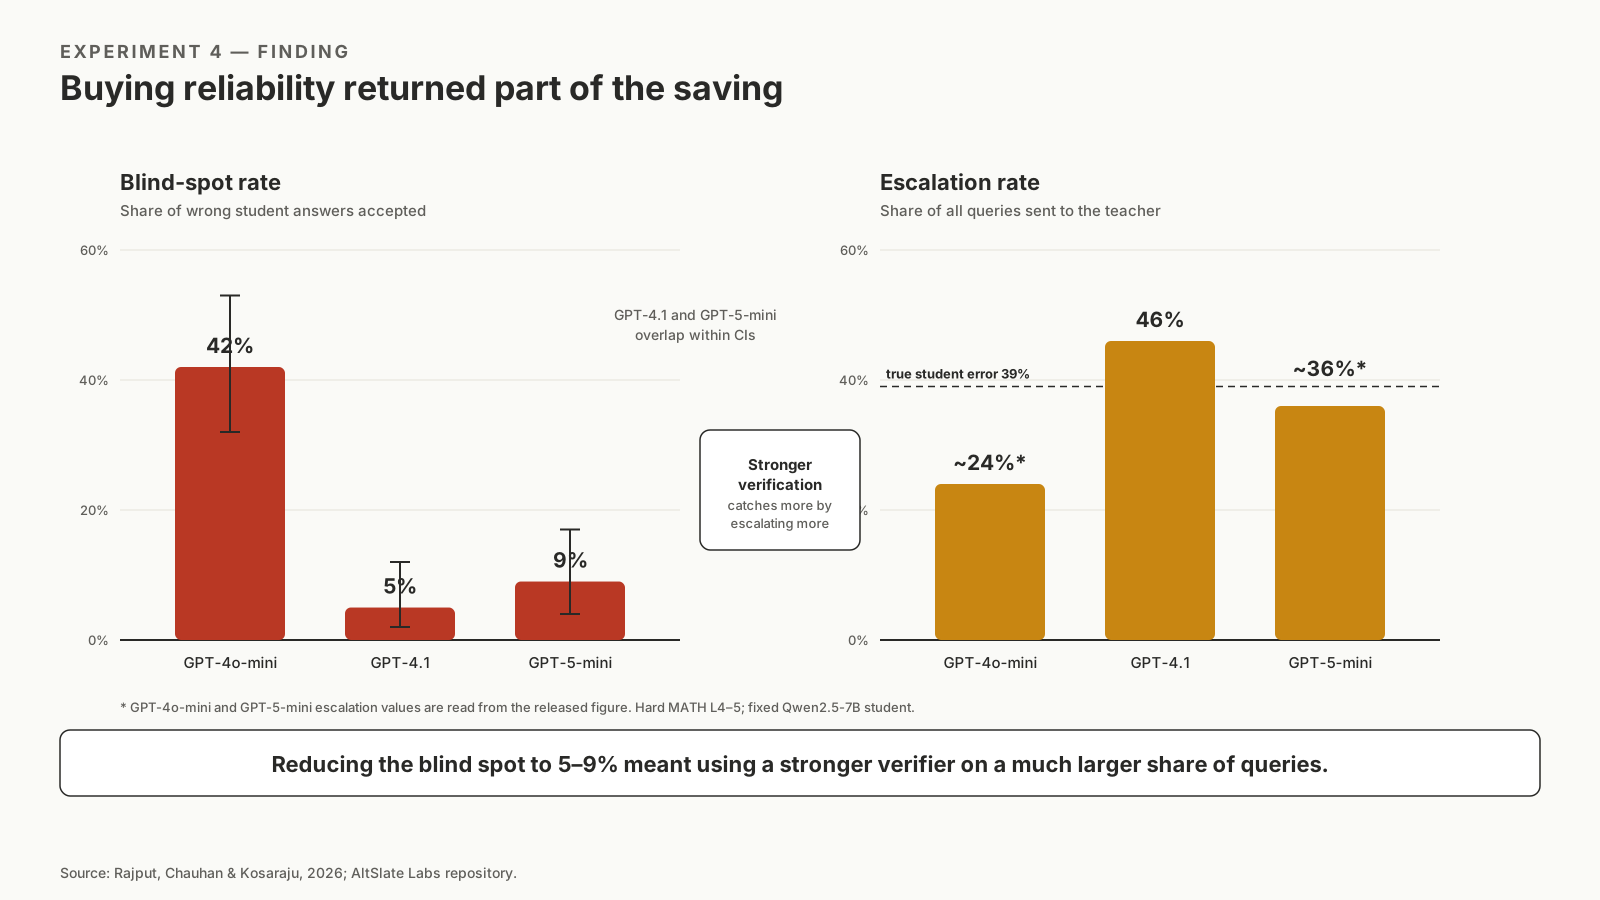
Finding. Using stronger verifiers sharply reduced the blind spot — the share of wrong student answers that were accepted — but it also forced many more queries to be escalated to the expensive teacher. Reliability improved while part of the cascade's cost saving was lost. The trade-off is direct: the more the system pays to catch subtle errors, the less of the original cost advantage remains.
Independent Quality Audit Is Part of the Unit Cost
These experiments expose different facets of the same accounting problem.
The student sets the base inference cost. The verifier controls acceptance and escalation. The teacher adds correction and potential training value. But none of these components provides independent evidence that the delivered outcome is correct.
The paper recommends an independent quality audit: a periodic sample evaluated against independently verified answers outside the operational verifier.
The authors call this "not optional instrumentation but the only instrument that can see the effect."
For FinOps, that audit should not disappear into general governance overhead. Evaluation is part of the control layer, and its cost belongs in the economics of a trustworthy outcome.
This audit component should be measured separately from inference and training costs:
Independent quality-audit cost per estimated qualifying outcome
= (Audit sampling costs + independent evaluator costs + audit tooling costs + adjudication costs)
÷ Estimated qualifying outcomes
This does not replace the broader cost-per-outcome calculation. It isolates the additional audit parameter that must be allocated to the control layer.
The denominator should be estimated using the independent audit sample — not the verifier's acceptance rate.
A falling escalation rate is not automatically evidence of improving efficiency. It may mean the student has improved. It may also mean the verifier is accepting more errors it cannot recognize.
Teacher-generated corrections are not automatically savings. Their economic value depends on whether they reduce the future cost per qualifying outcome after training and validation costs are included.
The observed capability–blind-spot relationship also implies that model upgrades should trigger verifier revalidation rather than being treated as automatic cascade improvements. Treat the verifier as a cost-control mechanism with its own failure mode, not as a ground-truth oracle.
Why Independent Audit Is Different From HITL
Independent quality audit is related to human-in-the-loop oversight, but it serves a different economic function.
As discussed in Why Human Oversight Is Becoming a New FinOps Cost Layer, the HITL layer maintains the capacity, attention, skills, workflows, and intervention readiness needed for people to review or stop consequential actions.
An independent quality audit does not need to approve every task or sit inside the operating workflow. It samples delivered outcomes outside the cascade and tests whether the student, verifier, teacher, and dashboard are producing reliable results.
HITL preserves the ability to intervene. Independent audit measures whether the system and its controls are actually working.
The same people may perform both activities, but the costs should not be counted twice. Reviewer time used for operational intervention belongs to the HITL layer. Time used to independently sample, evaluate, and adjudicate delivered outcomes belongs to the audit component of the control layer.
Before reporting a cascade as an optimization, FinOps practitioners should ask:
- What does each student, verifier, teacher, and training cycle cost?
- What percentage of queries reaches the teacher?
- What error rate does the operational verifier report?
- What does an independent audit sample show about delivered outcomes?
- Do teacher corrections reduce total cost per qualifying outcome after retraining and validation?
- Has the verifier been revalidated against the current student model?
The cost dashboard and quality dashboard may look separate, but if they rely on the same verifier, they are different reports built from the same instrument — and they share the same blind spot. Without an independent audit of real outcomes, fewer escalations and stable quality scores can hide rising user errors. That is a false FinOps win.
These sample experiments indicate that similar studies are needed to test how broadly the findings hold across models, tasks, and training methods. In any case, independent quality audit — often including manual review — should be treated as a permanent variable in cost calculations for AI cascades.
References
- Lingjiao Chen, Chi Zhang, Yeye He, Ion Stoica, Matei Zaharia, and James Zou. "The Price Reversal Phenomenon: When Cheaper Reasoning Models Cost More." arXiv preprint, version 2, May 2026.
- Dushyant Rajput, Nirdesh Chauhan, and Siddharth Kosaraju. "Cheap Verifiers, Large Blind Spots: Measuring the Reliability Cost of Cost-Saving Cascades." arXiv preprint, 2026.
- Code and experiment artifacts — AltSlate Labs
- Real-model experiment results and run notes — AltSlate Labs