More businesses pay for AI, and capable models are getting cheaper. The question is whether they deliver profitable customer outcomes and sustainable supplier returns.
Commentators including Chamath Palihapitiya and Apollo's Torsten Slok question whether venture-backed startups are recycling investment into AI bills rather than building self-sustaining demand.
Broad adoption, unequal spending
Ramp's October-vintage figures show that 55.9% of U.S. businesses observed through its corporate-card and bill-payment platform paid for AI in September 2026, up from 43.8% a year earlier.
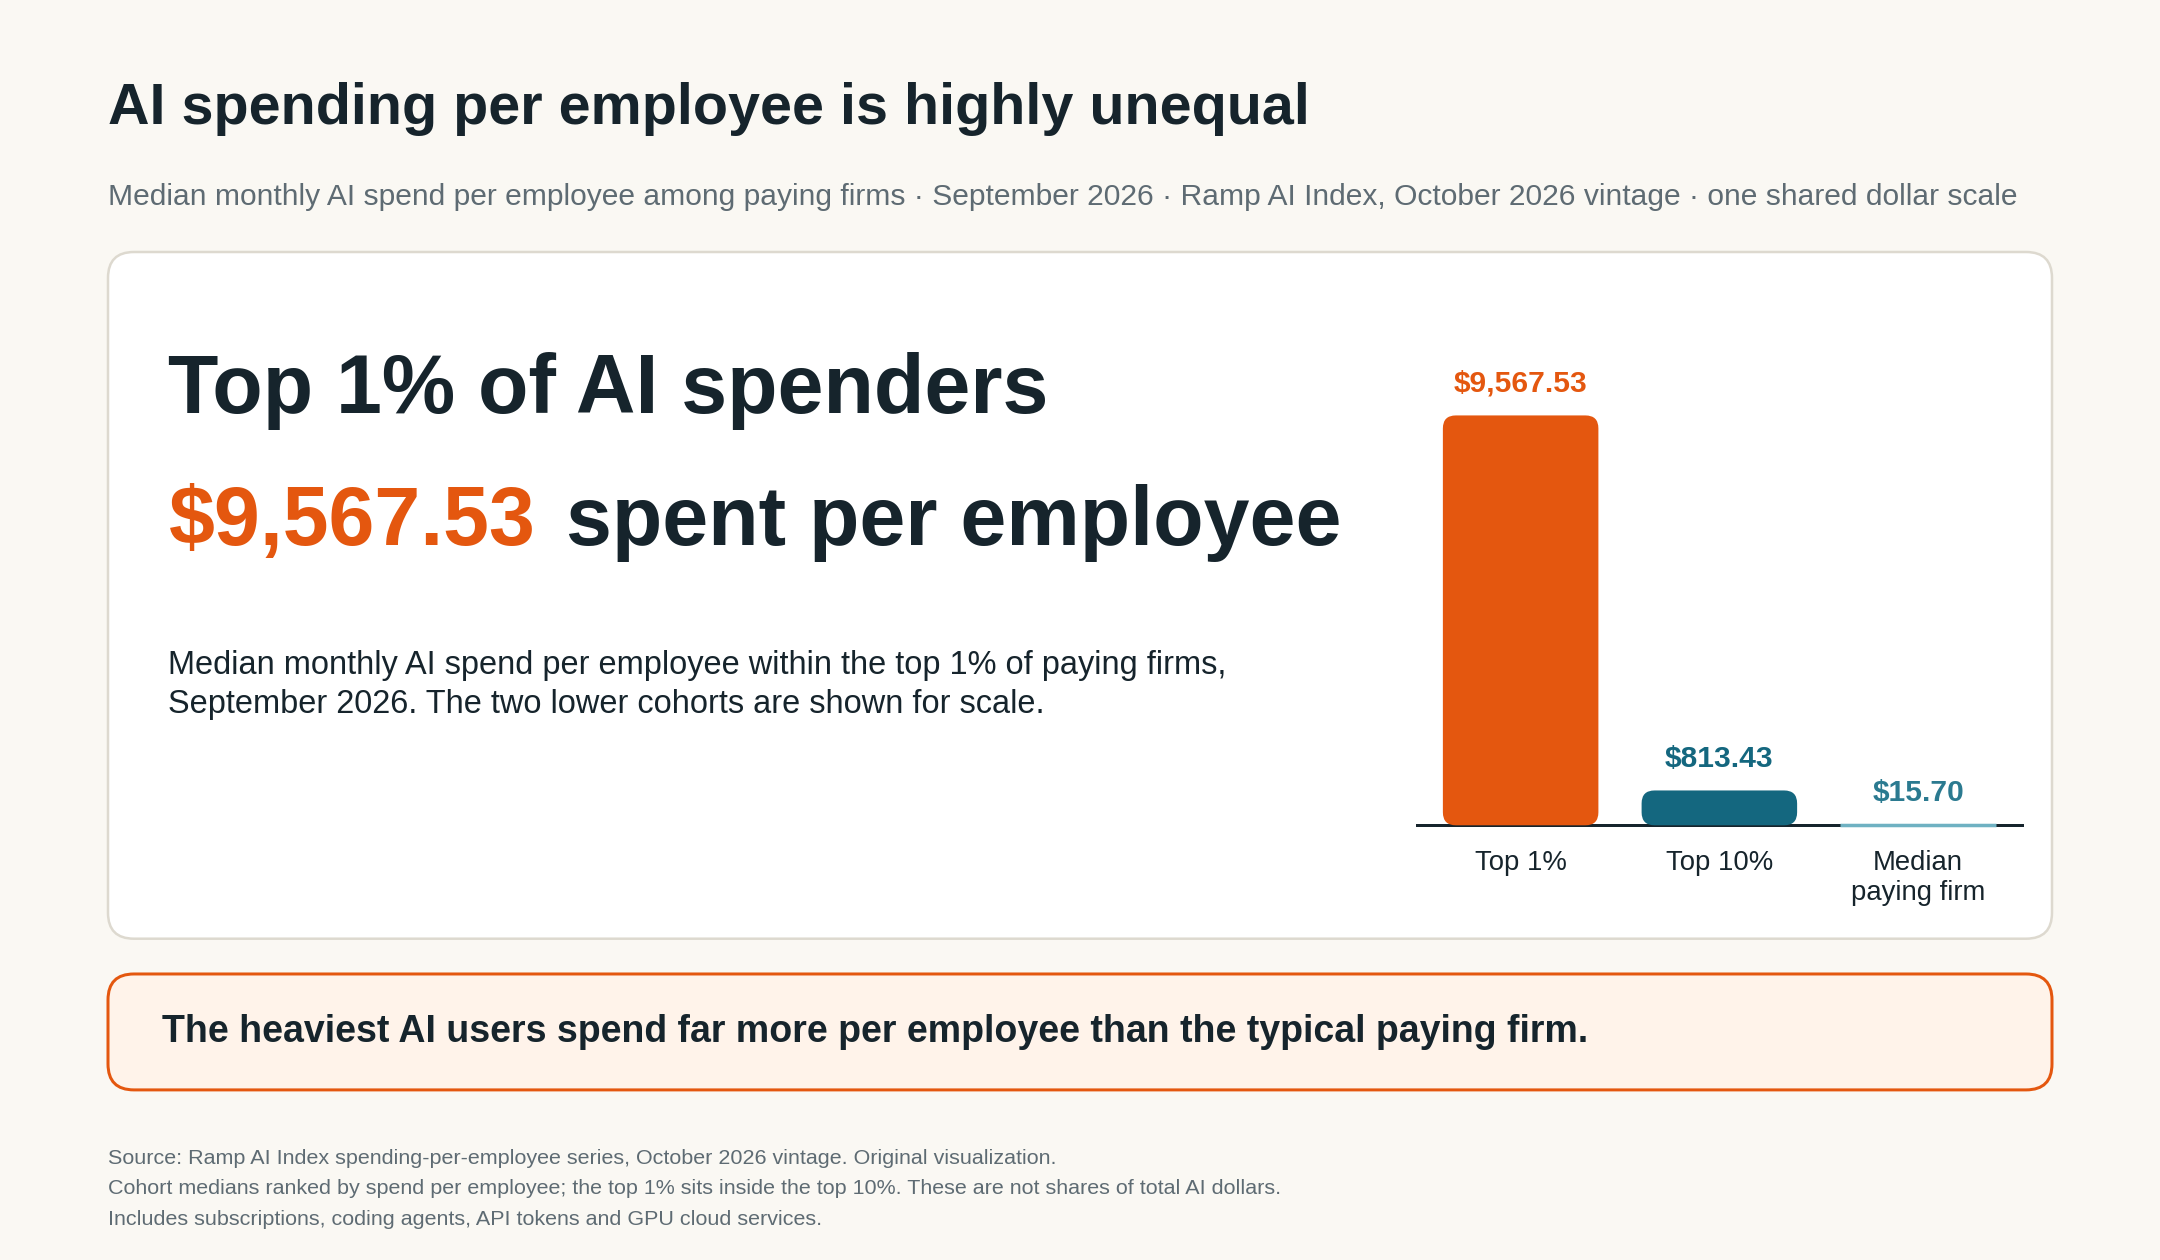
These are cohort medians, ranked by spending per employee; the top 1% sits inside the top 10%. Spending includes subscriptions, coding agents, API tokens, and GPU cloud services. In September 2025, the median paying firm spent $5.00 per employee; medians within the top 10% and top 1% were $209.91 and $2,515.49.
Spending rose across all three groups. The top-1% cohort's median spend per employee was roughly 609 times the median paying firm's in September 2026. Spending growth does not establish returns above AI-related costs.
Cheaper capabilities change the economics
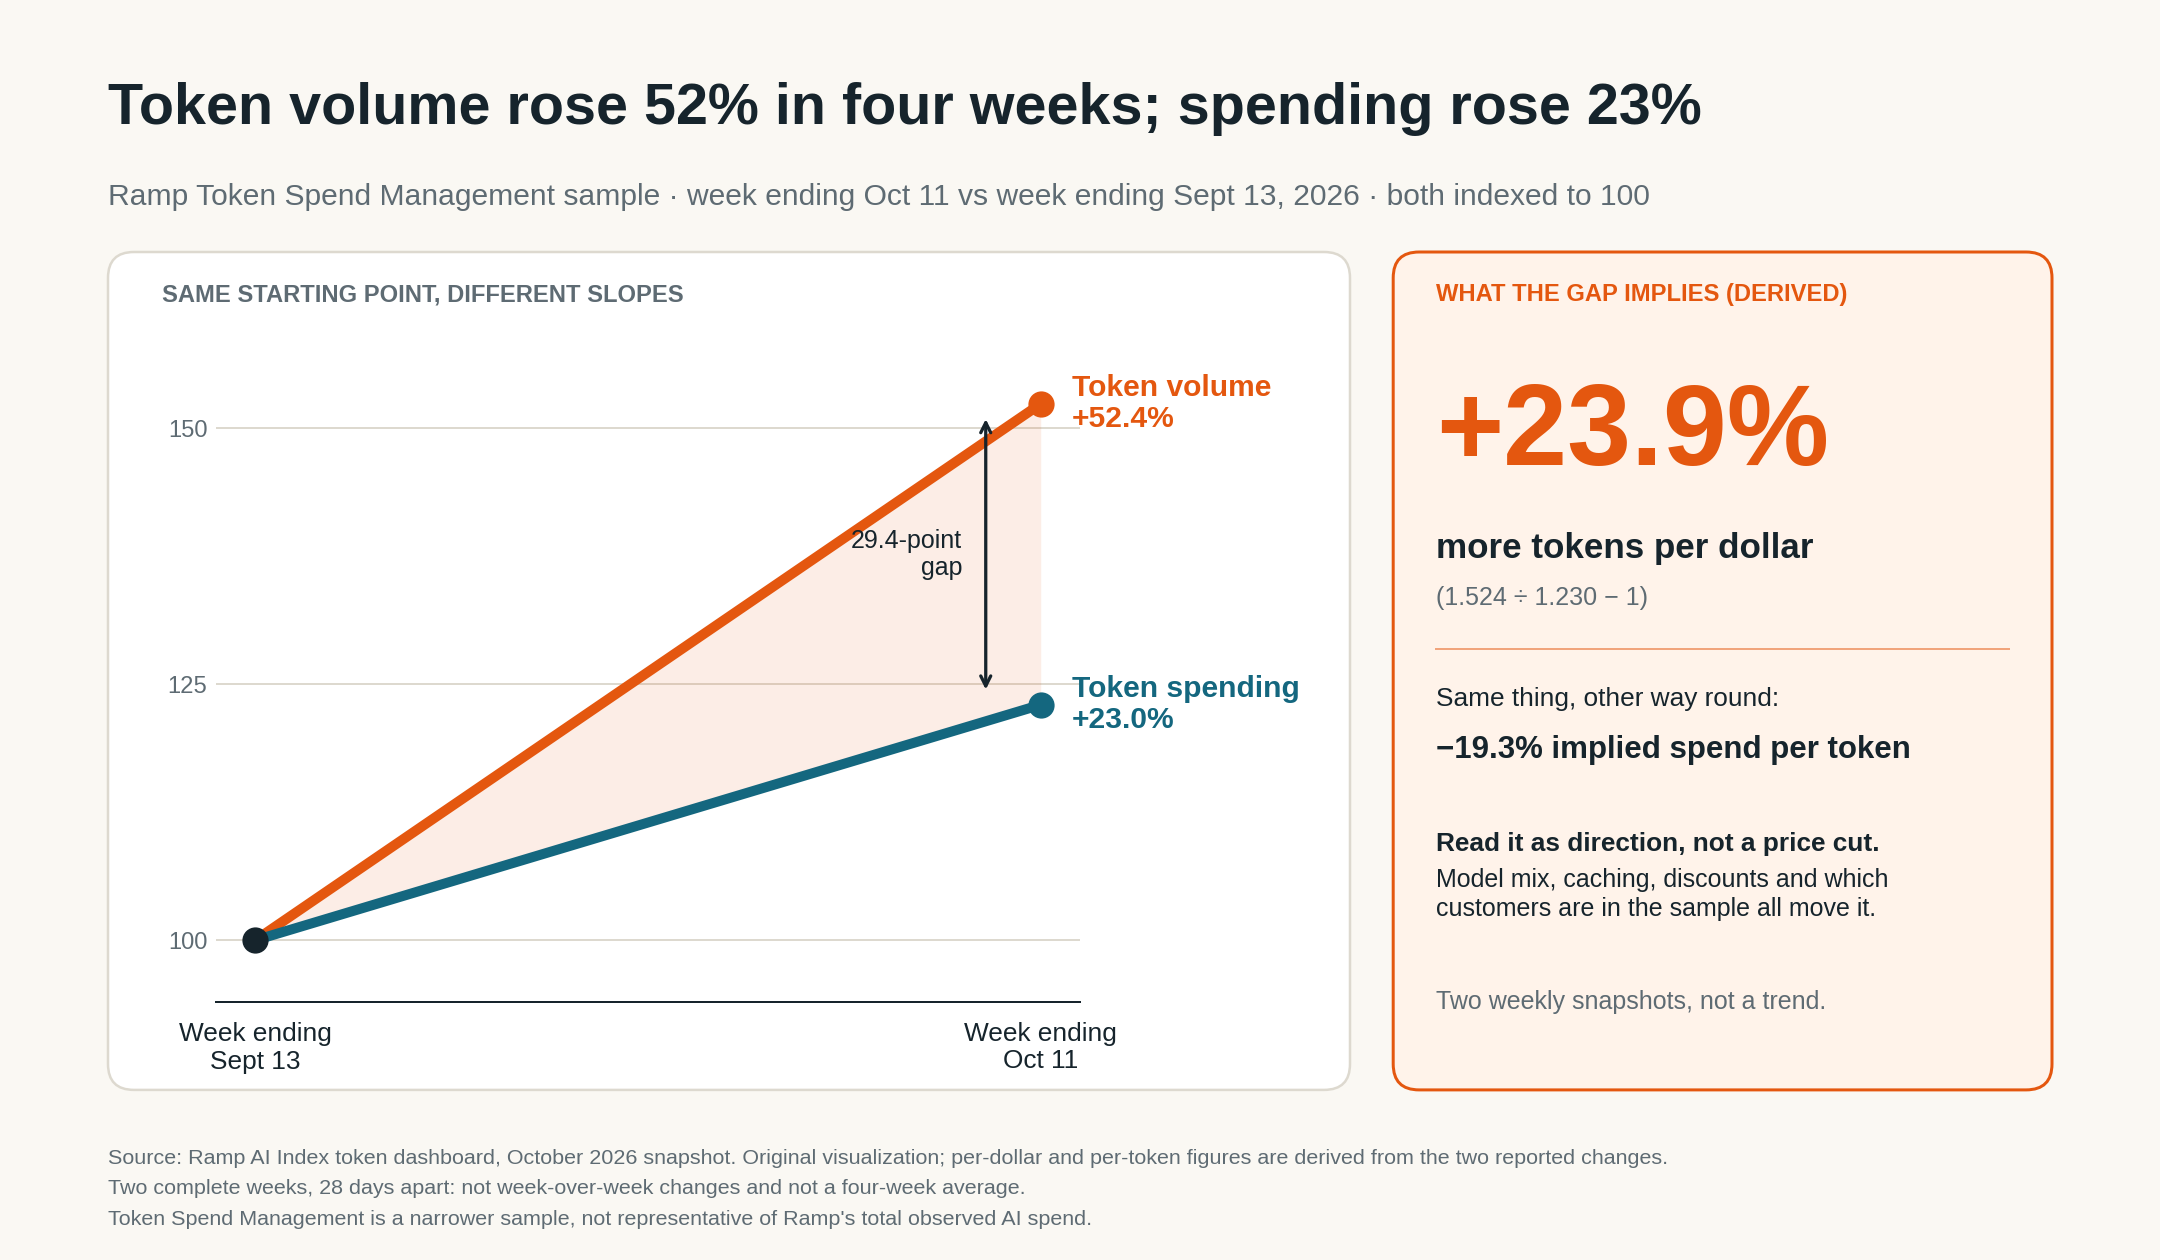
In Ramp's October token-sample snapshot, the week ending October 11 showed 23.0% more spending and 52.4% more tokens than the week ending September 13. These are two weekly windows four weeks apart.
Artificial Analysis's September 22 comparison evaluated GPT-6 against its GPT-5.6 predecessors at maximum reasoning effort:
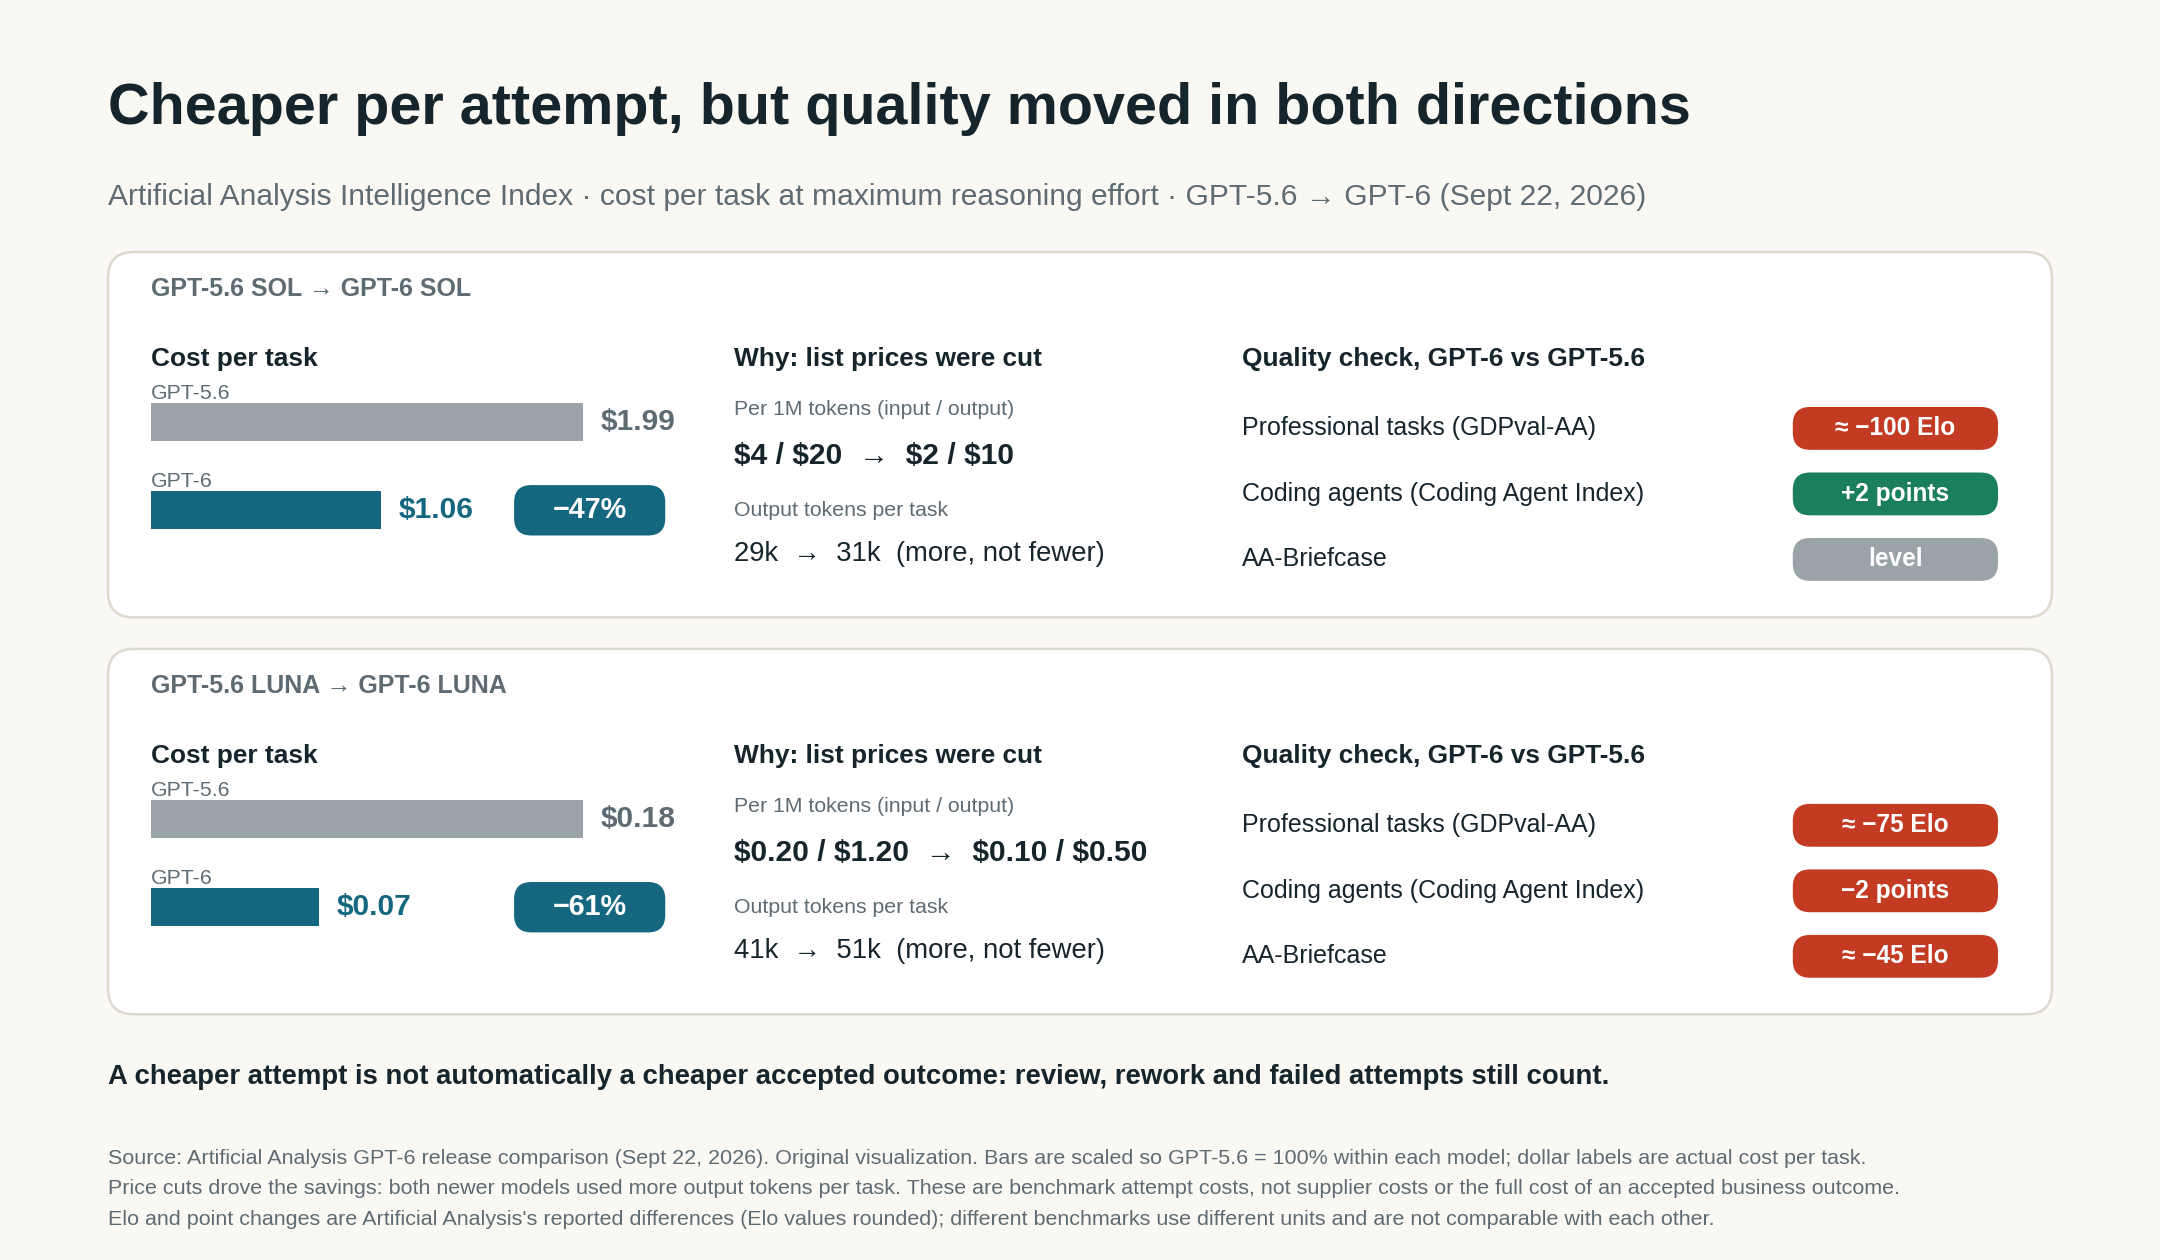
API price cuts drove the reductions. Input/output rates per million tokens fell from $4/$20 to $2/$10 for Sol and $0.20/$1.20 to $0.10/$0.50 for Luna. Both used more output tokens per task. Customer prices do not reveal supplier costs.
Price cuts and rising spending can coexist, as Apollo's June 12 Jevons argument emphasized. Suppliers must still demonstrate attractive margins at lower unit prices.
On GDPval-AA professional tasks, Sol fell about 100 Elo points and Luna 75. Artificial Analysis's own post links these regressions to shorter deliverables that omitted required elements. Lower prices create economic value only if review, rework, and exception handling do not consume the savings.
The payoff still needs to spread
Some workflows already show measurable gains. Studying one firm's staggered 2020-2021 rollout, a 2025 Quarterly Journal of Economics paper found that AI assistance raised issues resolved per hour by 15% on average among 5,172 support agents. This measures productivity, not profit (author's publication summary).
Apollo's October 24 charts show rising revenue per employee and margins among the Magnificent Seven, without comparable sustained improvement across the remaining S&P 500.
The Seven include AI suppliers and hyperscalers: their gains may reflect selling AI, not customer payoff. The S&P 493 includes other tech firms. Neither comparison isolates AI's contribution or establishes "zero financial payoff."
Apollo also reports that 80.4% of businesses in the top 1% of AI spenders are VC-backed, compared with 13.1% in its "median spender" comparison. The VC-backed share of all Ramp customers is not disclosed.
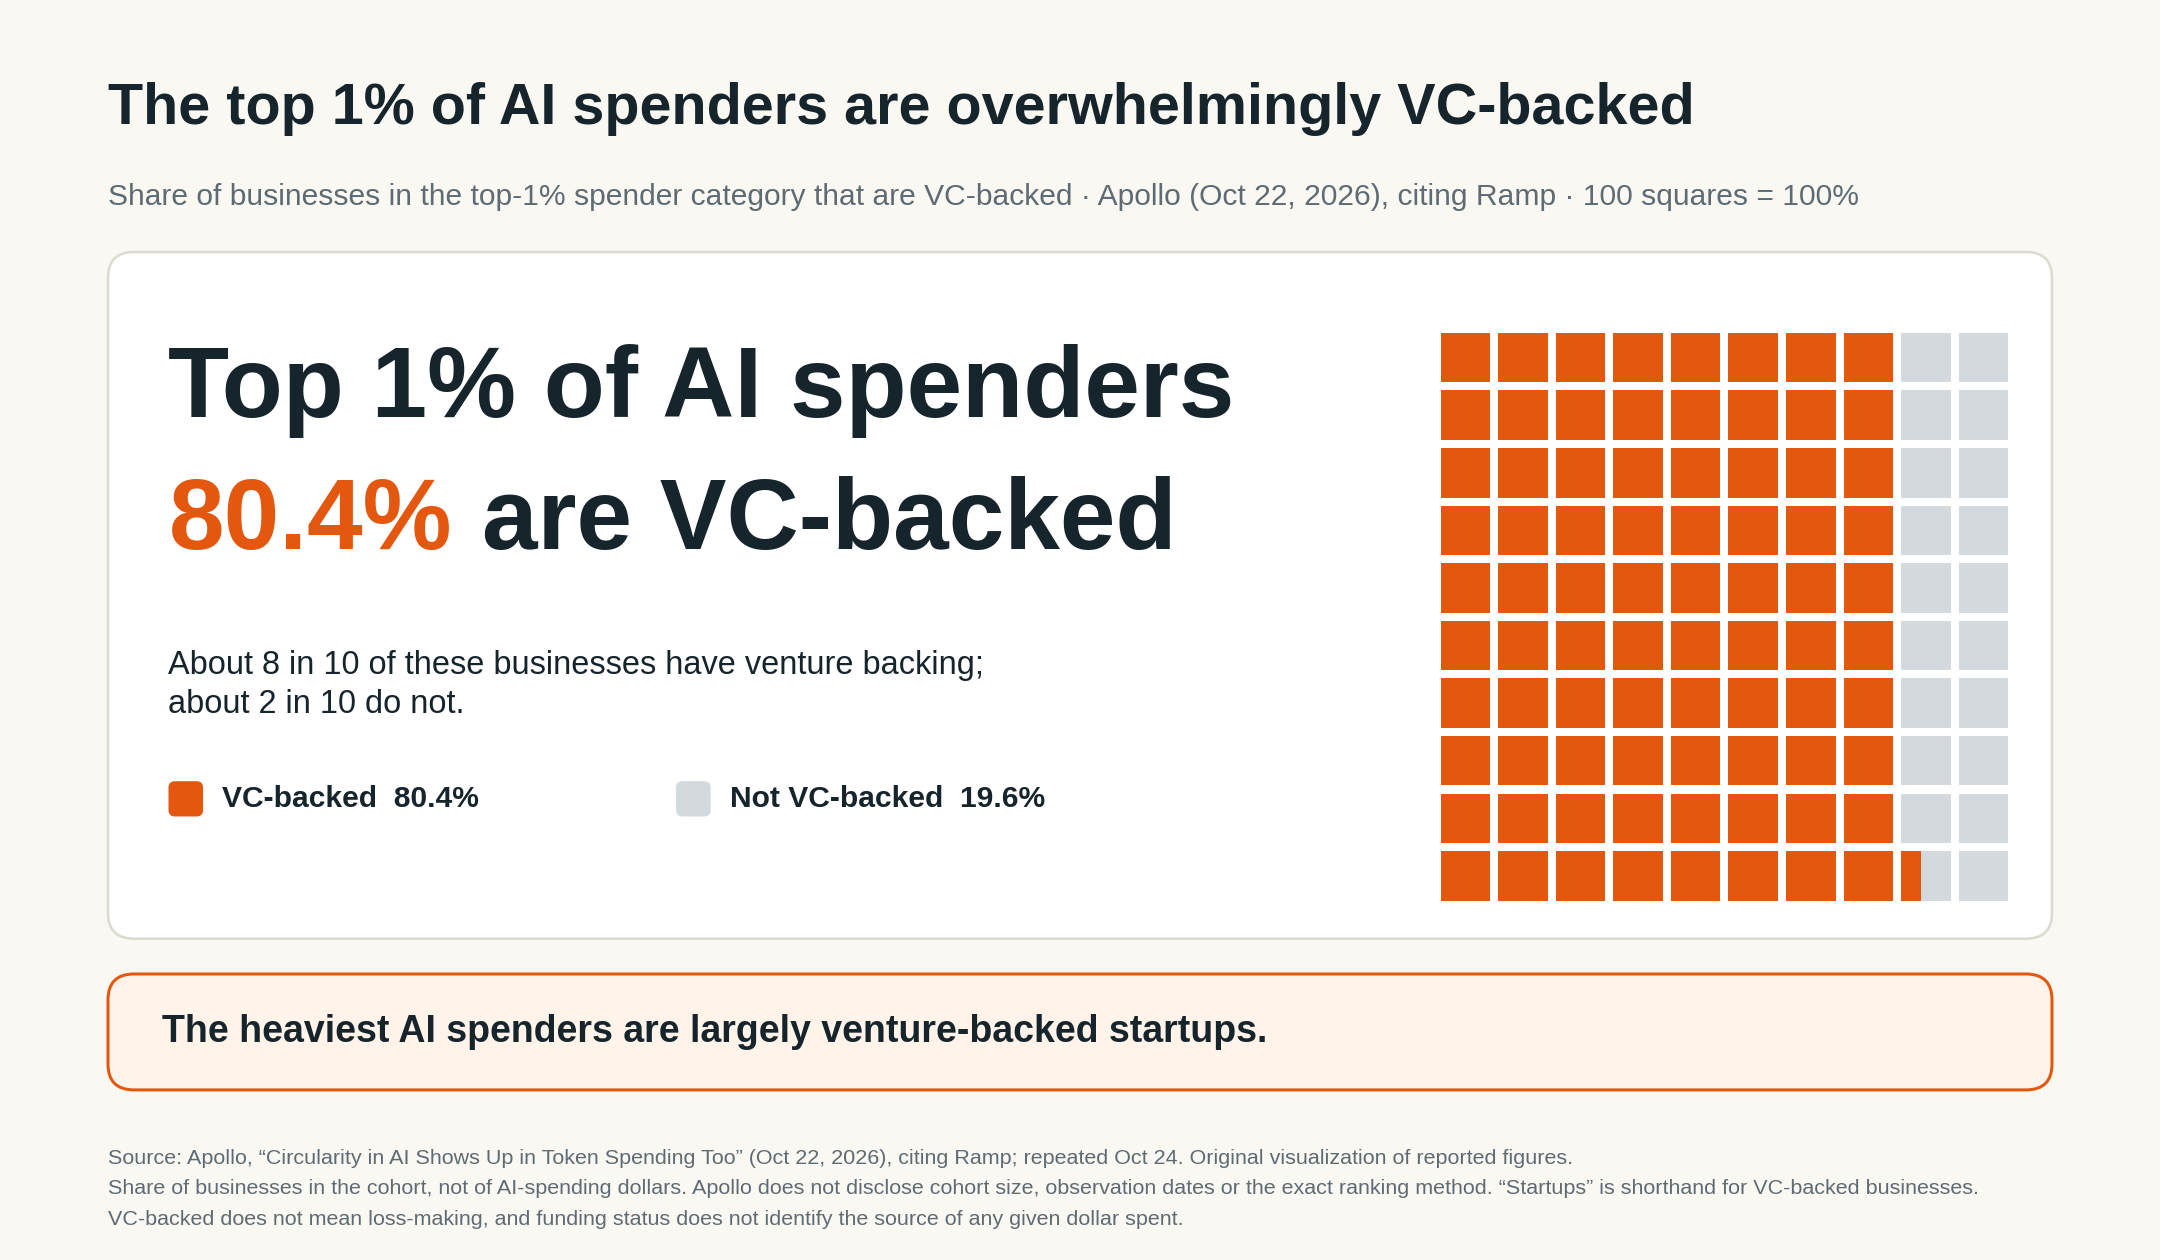
These are shares of firms, not dollars. Apollo leaves "median spender" undefined: the comparison suggests financing-linked concentration, not causation. Backing status does not reveal whether customer receipts pay AI bills.
If ranked by spending per employee, small headcounts can elevate firms into the top group. Size and sector could therefore influence the comparison.
Data boundaries: Ramp is not nationally representative; its narrower Token Spend Management sample does not represent total observed AI-spend volume. Apollo omits funding-cohort sizes, observation dates, and ranking methodology. Artificial Analysis measures benchmark costs.
Adoption is broadening and capabilities are cheaper. Whether customers pay enough to sustain delivery, and suppliers earn adequate returns at scale, remains unresolved.
Adoption, spending, and token volumes are not the end goal. Business outcomes are. AI economics will ultimately be judged not by what organizations consume, but by the value they create.